A few years ago, Graphite appeared and the world rejoiced. Finally there was a fun new database that was simple to use, relatively simple to setup and drew pretty pictures.
Since then, there’s been a bit of an explosion of “things that will store datapoint triples” (i.e. a name, timestamp and a value). I used InfluxDB for a while, which is very easy to setup and integrates well with monitoring systems like Sensu. However, the new hotness appears to be Prometheus.
Prometheus is another open source “metrics database”, but follows a slightly different model to the rest. Most other solutions come packaged as some sort of “server” in the traditional sense of “a process that sits there and waits for clients to connect and do things”. For InfluxDB, Graphite etc. a client makes a request of the system to store one or more points, and the server handles that request. Prometheus takes a different view: the database itself reaches out to one of more remote endpoints, scrapes whatever metrics are available there and adds them to the datastore. This has (at least) three interesting consequences:
- You have to run a server process on, or near everything that you want to monitor. Something that can expose the metrics to Prometheus when it asks
- Prometheus needs to know where everything is so it can connect to it and ask for data
- Data capture frequency is determined by prometheus, not the thing that’s capturing the data
(1) is interesting in that it quite fundamentally changes the typical model that many monitoring systems use to gather data. Usually, some sort of process running on a client will periodically wake up, collect some data and then post it off to a server. Here, the datastore wakes up, connects to everything it knows about and asks for data. If you happen to have clients behind NAT, this may cause some complexity in allowing the datastore to connect to the client. Prometheus has a Node Exporter daemon, which is a lightweight process that exposes host metrics over HTTP. Happily, this seems to be pretty extensible.
(2) is a natural consquence of (1). It’s interestingly a completely different approach to something like Sensu where the entire architecture is driven by the premise that the monitoring system does not know anything about the clients. With Sensu, clients self-register, which means that if you’re running on some sort of dynamically scalable infrastructure, you can just add More Stuff and have it magically show up in Sensu. With Prometheus, you’d have to orchestrate updating the configuration as you scaled up and down. Of course, the philosophy here is that monitoring / graphing system should know where all the clients are and how to connect to them, which is an interesting perspective.
For (3), this seems to relate to scalability. If you have a bunch of different frequencies you want to capture on, one option is to configure Prometheus to scrape at the lowest level and just tweak the relevant exporter daemons to update at different intervals. The issue may then be as the infrastructure grows, Prometheus ends up making lots of unnecessary checks to endpoints that aren’t updating that often. Presumably this can be solved by deploying multiple Prometheus servers and federating across them. Still, complexity required.
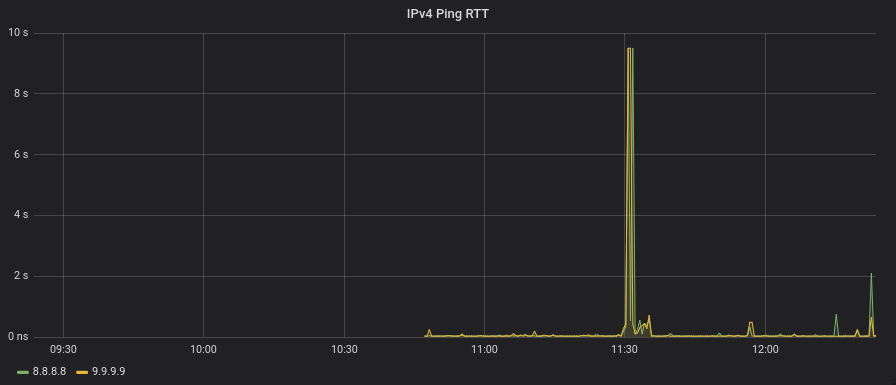
With all that said, I’ve been pretty impressed. I’ve been running Prometheus, the node_exporter, the blackbox exporter and Grafana on my laptop for a while, and it barely uses any noticable resources. At the same time, I can now draw fun graphs of things like ping RTT to judge the quality of various wifi networks here and there:
