I’ve been meaning to write this for a while now, but never really got around to it. I now have a spare afternoon, so I thought it’d be worth jotting down a few things about my new favourite thing: Graphite.
Graphite is a rather fresh new approach to solving the reasonably tricky problem of graphing things over time. Typically, this problem is directed at the systems-monitoring-type of domain, but there’s no reason why you couldn’t graph pretty much anything you like with it.
Sticking to system monitoring, drawing graphs is important. It’s how you know whether what’s going on right now is typical, or if it’s different to what’s happened before and there’s some sort of issue. It’s how you know when you need to buy more disks, or a bigger box, or more memory. It’s important stuff.
In the past, I’ve relied on Cacti to do all the graphing I’ve needed. There’s other bits of software that take the same approach, but that approach is similar: Define what you’re going to graph, and then wander off and go and get the data from source. Usually, SNMP is the mechanism that allows data to be pulled in and graphed over time. SNMP has been around for about a million years, and serves its purpose very well. The issues arise when you try and do something that there isn’t a default provider or MIB for, and then you’re in a sligthly strange universe of writing little scripts that play nicely with whatever snmp daemon you’re running on your data source.
Graphite takes a different approach - it doesn’t care what you want to graph, it just opens a TCP port and waits for you to fling data at it. As long as the data you throw at it conforms to a simple pattern: “Key Value UnixTimestamp”, it will store that value against that key at the specified timestamp. Key strings can contain dots (periods for you US-people) to denote a hierarchy, so the key ‘webserver1.memory.usage’ will be presented as being the ‘usage’ metric of the ‘memory’ node of the ‘webserver1’ tree. You can, I think, have as many of these as you like.
Whatever Graphite receives, it’ll dutifully store, and if you have multiple points in time against the same key, you can get a graph. In reality, this means that data collection is a little less elegant than something like SNMP because you now need to write a script to somehow gather data, format it correctly and then netcat it along to Graphite. There’s a number of SNMP-to-Graphite bridges that will essentailly periodically query certain SNMP data and then format it correctly before passing it onto Graphite. I’ve had some success using collectd for this, and it’s useful where SNMP is your only option for gathering data from a device (think network switches / routers).
Much of the time, it’s far more flexible to write a script, bung it in cron and just sit back. If anything, it seriously hones your awk and sed skills. I’ve shoved some examples of scripts that I use for capturing interesting data over at my Github gist page.
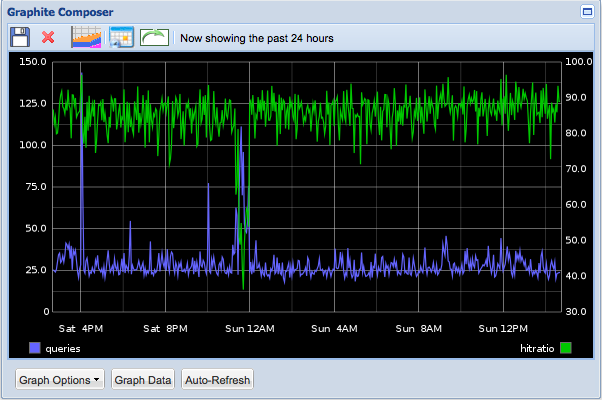
For example: the unbound script queries the unbound stats, parses them and adds into Graphite. Then you can draw cool graphs like this:

This is two series, the left is:
aliasByNode(unbound.namebot.total.num.queries,4)
and the right is:
alias(secondYAxis(scale(divideSeries(unbound.namebot.total.num.cachehits,unbound.namebot.total.num.queries),100)),"hitratio")
This brings me to the second reason why Graphite is awesome: you can build graphs and function them on the fly. The second series is just taking two series, dividing one by the other, multiplying by 100 to get a percentage, bunging it on the right hand axis and calling it something sensible. That’s a relatively simple transformation to get a simple ratio, the possibilities are much, much greater. It’s worth looking at the Graphite functions page to get a better idea of what you can do.
The final reason is the deliberately modular way in which graphite is built. The collector (carbon), data storage ( whisper) and frontend (django web-based) are all user-swappable. Mostly, people swap a different frontend in, and there’s a few that do an awesome job of being better than the default. Tasseo is one option, along with Graphiti. There’s loads though.
There’s also a wealth of software out there to help get data in. I’ve already mentioned collectd, statsd is another one that looks really useful, but I’ve not had a chance to play with.
Ultimately, despite the slightly greater effort required to get data in, Graphite is much easier to work with and get meaningful insight into what’s going on inside an infrastructure than anything else I’ve used. There’s some really useful sources on the internet written by much smarter people than me that really shows what you can do with this. I’d recommend starting at the Graphite posts on obfuscurity’s blog and moving on from there.