So I like graphite a little bit. It’s useful stuff.
But then I came across Diamond. Diamond is basically a little python daemon that runs on a box, collects a bunch of stats, and forwards them on to graphite for you. So rather than write your own scripts and shoving them through netcat, just use Diamond. Manage the config files in puppet, and you’re sorted.
You might find you need to be a little bit cunning, but this is another place where graphite becomes awesome again. Take CPU usage - this is something I want to graph. However, the diamond CPUCollector puts the following metrics into graphite, per cpu (and total):
- guest
- guest_nice
- idle
- iowait
- irq
- nice
- softirq
- steal
- system
- user
Now, I care about all of these things. However, sometimes I just want a single metric for that box to tell me roughly how much CPU it’s using. Which do I pick? I could do a sumSeries on all of these except for ‘idle’, but that feels a bit messy. Surely there’s a better way?
There is. ‘idle’ is exactly what I need - after all, it’s a measurement of how idle the processor was. The problem with that is a graph of ‘idle’ is 100 when the box is idle, and 0 when the box is under load. How do we flip the graph?
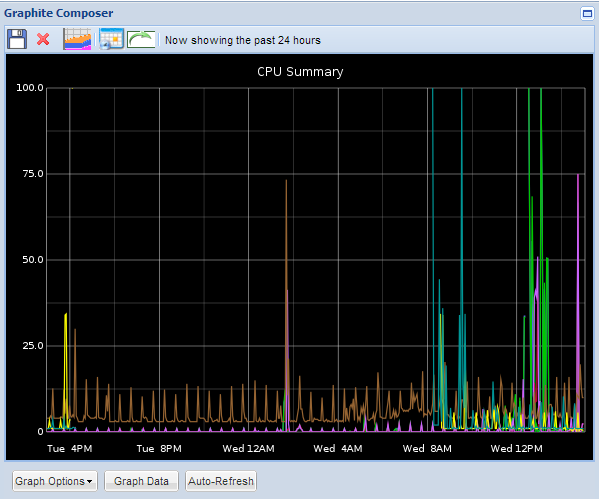
Graphite helps out. First, we scale() the metric by -1. This flips the idle graph, and it now runs between -100 and 0. Next we simply offset() the graph by 100, so it goes from 0 to 100 instead. For good measure, we do an aliasByNode() to get sensible labelling, and you get the following:
aliasByNode(offset(scale(servers.*.cpu.cpu[0-9].idle,-1),100),1)
